E-Maths Graphs questions may look intimidating to some students but they are actually quite straightforward and are often restricted to only a few marks in Paper 1 – leaving them with the dubious honour of taking up the most paper space but offering the least marks.
Think of them as marks on a platter, and you don’t really need to be an artist to sketch well.
Nonetheless these are the if-you-got-study-then-you-will-score type of questions, so you die die have to get yourself familiarized with the 12 Graphs of Functions in your text book.
But do bear in mind that their simplicity may make some evil examiners so ashamed of themselves that they have to resort to some lame twists just to squeeze out that extra 1% of your brain juice. As with many of Miss Loi’s questions, always remember the actual exam questions will seldom look the same as what is in your textbook, but with an additional step on your part, you’ll find that they are actually the same thing!

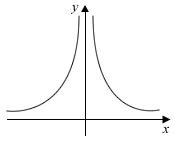
- The sketch represents the graph of y = xn.
Write down a possible value of n.
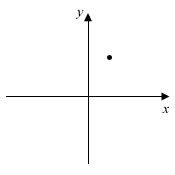
- The point (1, 2) is marked on the diagram below. On the diagram, sketch the graphs of
- y = (1/x) + 1
- y = 2x

P.S. Before any of you A-Level student, or Uni Math Major, or PhD or whatever start screaming “Walau! Don’t insult my intel! My grandmother also can do this!”, do note that we are talking about Secondary School E-Maths level here.
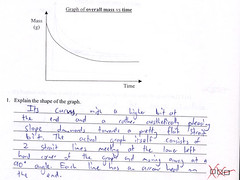
P.P.S. Miss Loi understands that not everyone is proficient with an image editing software, so should you wish to ‘sketch’ these out in the comments, maybe you can answer the way this student did 🙂


 Miss Loi is a full-time private tutor in Singapore specializing in O-Level Maths tuition. Her life’s calling is to eradicate the terrifying LMBFH Syndrome off the face of this planet. For over years she has been a savior to countless students …


4 Comments
曜
日
1. A possible value of n is -2.
Yes the sketch depicts a classic graph which is one of the 12 Graphs of Functions in your text book, where a > 0
In this case, a = 1 and n = -2. Actually to probe further, the graph looks similar for n = -2, -4, -6, ... (all negative even numbers) 😉
2i.
The curve on LHS of x-axis cuts x-axis at (-1,0).
The curve has no maximum or minimum value.
and the curve passes through the given point!
You did a great job in highlighting the asymptotes i.e. where the graph approaches zero or infinity.
However EMaths students simply need to first recall the shape of (shown in grey in the diagram above), and then understand that the constant (+1) in
  means that we're shifting upwards
  by one unit (see diagram above again).
Lastly, substitute the values (1, 2) into the equation ⇒ 2 = 1/1 + 1 (LHS = RHS!) ⇒ the graph passes through this point!
P.S. Don't assume that the graph will always pass through that dot in your question! Sometimes the graph passes to it's left/right/top/bottom - always sub in its coordinates to check!
2ii.
never cuts x-axis but as ,
,  .
.
the curve passes through (0,1).
The curve has no maximum or minimum value.
and the curve passes through the given point!
Once again, EMaths students will recall the shape of the graph of (they all intercept the y-axis at y=1 since a0 is always 1 and look similar in shape regardless of the value of a, as long as a is positive.
So the only thing left to do is to substitute the values (1, 2) into the equation ⇒ 2 = 21 (LHS = RHS!) ⇒ the graph passes through this point!
Poor candidate in your picture. He has written something meaningful, not just freaking with abc's.
Miss Loi too thinks that he deserves some sympathy marks for his back-to-basics description - to highlight the little things in life that we tend to take for granted 😉
曜
日
oh dear. Line 3: from the negative x-axis:
(I wonder why T must be placed next to Y.)
Corrected for you 😉 Fatty fingers?
曜
日
*Creeps in silently to add some diagrams and explanations to fggffggf's answer to improve clarity*
曜
日
Actually it was a typo, the problem with lighting typing.
Oh, and from this post on, I will identify myself as Li-sa and you might see my Li-sa footprints on some other blogs, like on squareCircleZ.
The blog I originally had will be shut down soon so no website link is given here.
Miss Loi, you don't have to creep in silently. Utmost silence looms like a thief.