Paiboon Sirimahboonkrongwattanapattayabangkokshinawatrachatuchakwong (let’s just call him Boon for short) is a foreign student in Singapore.
Given the chance to study in Singapore’s famed education system through his father Mr Sirimahboonkrongwattanapattayabangkokshinawatrachatuchakwong, who selflessly saved up enough money from years of hard work in Singapore’s construction sites, Boon aspires to become a Singapore Citizen one day, to embrace Singapore as his home, where he can pwn all lazy local students in maths and football, and still be able to enjoy his Pad Thai at Golden Mile Complex.
To that end, Boon is a little embarrassed that he doesn’t yet know how to sing the full national anthem of Singapore, for he has always been late for his school assembly aka Mari Kita, arriving just in time to catch the last “… Majulah Singapore!” verse of the anthem, and the second-last verse if he’s lucky (which doesn’t help much as the last two verses are exactly the same).

often differ from the hypothesis
His hopes of learning another verse of the anthem is dashed each day as, despite his best efforts to wake up early, he has been consistently ‘played out’ by the erratic waiting times of the two bus services (leaving from different bus stops) plying the route between his school and his dormitory located within earshot of snarling residents in an ulu peaceful estate in Singapore’s northeast i.e. when he waits at Bus Stop A, Bus Service B arrives and vice versa (you know the drill).
Frustrated, he decides to stick with one bus service once and for all.
And so after a session of statistical enlightenment from a powerful priestess at a local Temple,
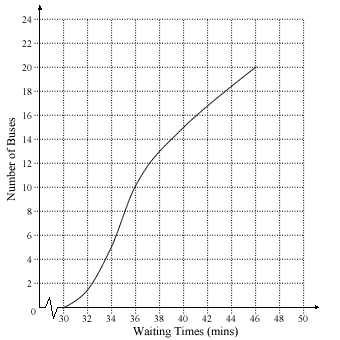
The waiting times for the two bus services was collected over a period of time:
Bus Service A:

For Bus Service B, he got lazy:
| Stem | Leaf |
|---|---|
| 20 30 40 | 2 3 0 1 2 6 6 7 9 9 3 3 3 4 6 6 8 8 9 9 |
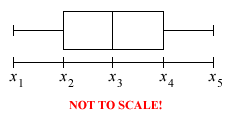
A box-and-whisker plot is then drawn to represent each set of data above:

- For each bus service,
- Find the values of x1, x2, x3, x4, x5
- Find the range of its waiting time.
- Find x4 – x2. What does this represent?
- Compare and comment on the waiting times of Bus Service A and Bus Service B. Which service should Boon stick to?
As another addition to the E-Maths New Syllabus this year, box-and-whisker plots will likely jump out like mice to scare you at the end of your usual cumulative frequency distribution question.
But despite its bizarre-sounding name, it’s worth noting that box-and-whisker plots have nothing to do with mice but are just an eye-soothing way to summarize and present the same data from your stressful cumulative frequency curve, stem and leaf diagram, dot diagram etc. etc.
In fact, most of the stuff you need to know about box-and-whisker plots in O-Level Emaths are all found in this question. These are easy marks (albeit not many) being served to you on a platter – so don’t miss out this little topic when you’re studying!

 Miss Loi is a full-time private tutor in Singapore specializing in O-Level Maths tuition. Her life’s calling is to eradicate the terrifying LMBFH Syndrome off the face of this planet. For over years she has been a savior to countless students …


