 What’s the difference between the Kinematics question below and the previous one?
Just like stubborn Physics students who insist on using their super duper rocket science motion equations to attempt A-Maths kinematics questions, equally-stubborn A-Maths students will insist on using their Level 99 magical differentiation and integration powers to tackle E-Maths kinematics.
These Paper 1 questions usually take up a paltry 6 marks. Though it’s still around 7-8% of your overall Paper 1 score, Miss Loi thinks you should save up your ultimate Level 99 skills for the bosses later.
So what exactly is the difference? … Graphs!

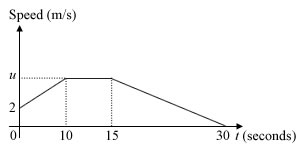
The diagram is the speed-time graph for the first 30 seconds of the motion of an object.
- Given that the distance covered by the object in the first 10 seconds is 60 metres, find the value of u.
- Find the speed of the object after 16 seconds of motion.
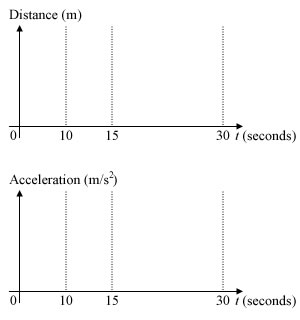
- On the axes given below, draw
- the distance-time graph for the first 30 seconds of the motion of the object.
- the acceleration-time graph for the same 30 seconds.

Having sacrificed their work-life balance to painstakingly churn out these graphs on (heaven forbids) MS Word, do you seriously think the examiners (and Miss Loi) are going to simply let you ‘off the axes’?
Once again, think about those who don’t take A-Maths for a schooling. Concept of gradients, similar triangles etc. are some of the rudimentary Level 1 powers they have at their disposal 🙂
P.S. It is imperative you already possess the Level 2 skills of deducing Speed-Time, Distance-Time and Acceleration-Time graphs from each other when you attempt this. And please don’t fall into the trap of getting stuck in the overrated speed = distance/time thingy. We don’t draw the graphs for fun!


 Miss Loi is a full-time private tutor in Singapore specializing in O-Level Maths tuition. Her life’s calling is to eradicate the terrifying LMBFH Syndrome off the face of this planet. For over years she has been a savior to countless students …


