Paiboon Sirimahboonkrongwattanapattayabangkokshinawatrachatuchakwong (let’s just call him Boon for short) is a foreign student in Singapore.
Given the chance to study in Singapore’s famed education system through his father Mr Sirimahboonkrongwattanapattayabangkokshinawatrachatuchakwong, who selflessly saved up enough money from years of hard work in Singapore’s construction sites, Boon aspires to become a Singapore Citizen one day, to embrace Singapore as his home, where he can pwn all lazy local students in maths and football, and still be able to enjoy his Pad Thai at Golden Mile Complex.
To that end, Boon is a little embarrassed that he doesn’t yet know how to sing the full national anthem of Singapore, for he has always been late for his school assembly aka Mari Kita, arriving just in time to catch the last “… Majulah Singapore!” verse of the anthem, and the second-last verse if he’s lucky (which doesn’t help much as the last two verses are exactly the same).

often differ from the hypothesis
His hopes of learning another verse of the anthem is dashed each day as, despite his best efforts to wake up early, he has been consistently ‘played out’ by the erratic waiting times of the two bus services (leaving from different bus stops) plying the route between his school and his dormitory located within earshot of snarling residents in an ulu peaceful estate in Singapore’s northeast i.e. when he waits at Bus Stop A, Bus Service B arrives and vice versa (you know the drill).
Frustrated, he decides to stick with one bus service once and for all.
And so after a session of statistical enlightenment from a powerful priestess at a local Temple,
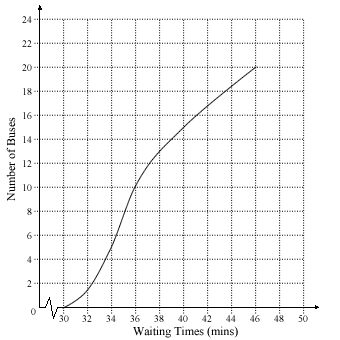
The waiting times for the two bus services was collected over a period of time:
Bus Service A:

For Bus Service B, he got lazy:
| Stem | Leaf |
|---|---|
| 20 30 40 | 2 3 0 1 2 6 6 7 9 9 3 3 3 4 6 6 8 8 9 9 |
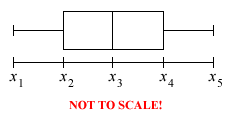
A box-and-whisker plot is then drawn to represent each set of data above:

- For each bus service,
- Find the values of x1, x2, x3, x4, x5
- Find the range of its waiting time.
- Find x4 – x2. What does this represent?
- Compare and comment on the waiting times of Bus Service A and Bus Service B. Which service should Boon stick to?
As another addition to the E-Maths New Syllabus this year, box-and-whisker plots will likely jump out like mice to scare you at the end of your usual cumulative frequency distribution question.
But despite its bizarre-sounding name, it’s worth noting that box-and-whisker plots have nothing to do with mice but are just an eye-soothing way to summarize and present the same data from your stressful cumulative frequency curve, stem and leaf diagram, dot diagram etc. etc.
In fact, most of the stuff you need to know about box-and-whisker plots in O-Level Emaths are all found in this question. These are easy marks (albeit not many) being served to you on a platter – so don’t miss out this little topic when you’re studying!

 Miss Loi is a full-time private tutor in Singapore specializing in O-Level Maths tuition. Her life’s calling is to eradicate the terrifying LMBFH Syndrome off the face of this planet. For over years she has been a savior to countless students …


7 Comments
曜
日
Someone should teach him to use SBS Iris. At least won't have to scratch head do maths work out average waiting times .... tsk tsk
😀
曜
日
Fingers crossed I don't make any silly mistakes...
1. Bus service A:
i) x1 = 0
x2 = 34
x3 = 36
x4 = 41
x5 = 46
ii) 46 minutes
iii) IQR = x4 - x2
= 7
Bus service B:
i) x1 = 22
x2 = 34
x3 = 41
x4 = 46
x5 = 49
ii) 27 minutes
iii) IQR = x4 - x2
= 12
2. Boon should stick to bus service A as its extreme scores and median are lower than that of bus service B's. Err, yeah, I have run out of persuasive points.
P.S. Your stem-and-leaf plot is very different to the ones I see at my school. Just a question: what grades would "E-Maths" be equivalent to, internationally?
曜
日
LTNS FoxTwo 😀
Iris? You mean this Iris???
Please don't sabo our dear foreign friend here (esp if he needs to take Service 61)!
曜
日
Kym: To be honest, Miss Loi wanted to put up more info on box-and-whisker Plots in the main blog post. But then that would be a little too easy, since box-and-whisker questions are generally easy.
So one needs to first get acquainted with the main parts of the plots:
P.S. Note the difference between range and interquartile range.
And since they're just another representation of the data that you have ...
曜
日
For Service A,
You first need to know where your Min/Max/Q1 ... 3 values on the cumulative frequency curve are:
and then map them to your box-and-whisker diagram:
where you got most of them right except for x1 and x4.
In cumulative frequency questions, tragedies often occur at the axes and the extreme ends of the curve.
Do you know that Miss Loi has ... umm ... cheekily extended the y-axis to 24 when the curve only ends at 20? Instead of looking at where the curve ends, some students (in their haste) are bound to erroneously assume that the total number of buses = 24 and use this to obtain their Q1/Q2/Q3.
While you managed to survive that, you were unfortunately caught out at the lower end of the curve - the minimum value (i.e. x1) cannot be zero as the curve starts at 30 (i.e. the lowest waiting time = 30 mins as none of the buses arrived in ≤ 30 mins).
Due to this, your range should be 46-30 = 16mins instead.
Also, not sure how you obtained x4 = 41 (careless reading of the graph?). This in turn affected your interquartile range which should've been 40-34 = 6 instead.
曜
日
For Service B,
We line-up all the terms in the stem-and-leaf diagram like prisoners in ascending order.
As the total number of terms here is 20 (an even number), we'll need to take the average of the two middle terms i.e. the 10th (T10) and 11th (T11) terms as the median (Q2).
Similarly we need to take the averages of T5/T6 and T15/T16 for the lower quartile (Q1) and upper quartile (Q3) respectively, since there are no terms that lie exactly at the 25% and 75% mark in the line of numbers.
No problems with your answers here *clap clap* 😉
P.S. How is the stem-leaf diagram different from the ones you have?
曜
日
And now for the Grand Conclusion!
Putting the two box-and-whisker plots side-by-side on the same scale (which is the main purpose of drawing these plots in the 1st place as they're very good at providing an easy visual comparison of different sets of data):
When presented with the above, our foreign friend Boon realizes in a nanosecond that he should stick to Bus Service A because:
An excited Boon says "KHAWP KHUN KHRAP!" and may he finally get to hear the verse "... Semua kita berseru!" soon!