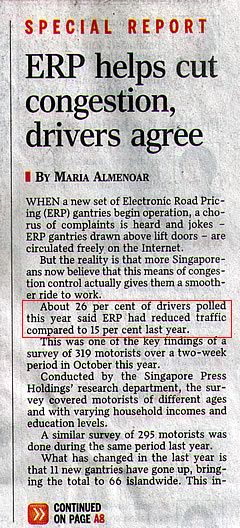
On Monday, Miss Loi saw this article on the newspaper that appeared initially to undermine the very core of her fundamental mathematical beliefs.

But upon closer inspection of the rest of the article, which went on and on and on about the minority side of things, she realized (to her relief) that there was probably a typo in the title – in which “More drivers agree” would sound more appropriate.
Because, if 26% is considered to be the majority, then are we having the right government running this country???! it’s simply mathematically incorrect.


 Miss Loi is a full-time private tutor in Singapore specializing in O-Level Maths tuition. Her life’s calling is to eradicate the terrifying LMBFH Syndrome off the face of this planet. For over years she has been a savior to countless students …


4 Comments
曜
日
Where did they found these 26% people?
曜
日
if only i had a tutor like you during my time, maybe i won't end up being that 0.5% of the cohort who scored B3 in E-maths lol
曜
日
In my opinion, I guess the way the writer uses his/her statistical example has mislead us. In statistics, it states that at least 50 sample size is required to accurately approximate the population size via Central Limit Theorem. With this statistical theory, I guess 26% of the drivers in Spore will definitely be more than 50 drivers, right? Hehe...
曜
日
Hmmm ... like Mr DK has mentioned, perhaps they could've provided more information on how the sampling frame of this survey was established i.e. where did they find the pool of motorists from which this 319 responses were picked?
As we know, the lack of a good sampling frame will induce bias in terms of missing out groups of people that may be a major constituent of the driver population e.g. conducting the survey in English will miss out those who don't understand English, or sending out the survey to a database of newspaper subscribers will miss out those who don't subscribe to any papers, or (god forbid) sending out the survey to all drivers working in LTA or SPH etc.
Also, in H1/H2 Maths we're introduced to the Simple Random Sampling, Systematic Sampling, Stratified Sampling and Quota Sampling methods.
Reading through the rest of the article, I understand that the same set of data is used to analyse other issues but if we're only interested in knowing if the ERP has indeed decrease traffic, samples stratified according to sub-groups/strata like the regions of the drivers' office/home addresses or the timing range of their journeys will probably ensure a better coverage of the drivers population (instead of age, income or education level).
But identifying the most appropriate sub-group/strata will not be easy in this case, which is one of the main disadvantages of stratified sampling.
Maybe others can share their thoughts on this?